> ## Documentation Index
> Fetch the complete documentation index at: https://koreai-content-gov.mintlify.site/llms.txt
> Use this file to discover all available pages before exploring further.
# Supervisor Dashboard
The **QA Dashboard** provides a centralized view of quality performance across **AI Agent** and **Human Agent** conversations. It combines audit metrics, evaluation outcomes, AutoQA coverage, adherence trends, coaching insights, and interaction analytics to help supervisors monitor quality, identify performance gaps, and prioritize coaching opportunities.
The dashboard uses shared global filters to analyze conversation data across **AI Agent**, **Human Agent**, or combined conversations.
The **Conversations Handled By** filter determines the conversation handler used for analysis and dynamically displays the applicable filters and evaluation data:
* When AI Agent is selected, the dashboard displays AI Agent evaluation data based on configured Experience Flows. AI Agent conversations are filtered using Experience Flow instead of Queue and Agent filters.
* When **Human Agent** is selected, the dashboard displays Human Agent evaluation data based on selected Queues and Agents.
* When both **AI Agent** and **Human Agent** are selected, the dashboard displays combined quality insights while preserving evaluation attribution based on the conversation handler.
All dashboard widgets update automatically based on the applied filter selections.
Using the QA Dashboard, supervisors can:
* Monitor quality performance and evaluation trends.
* Compare AutoQA and manual audit results.
* Analyze failed and fatal interactions.
* Track audit progress, coaching activity, and pending reviews.
* Evaluate AI Agent and Human Agent performance separately or together.
* Identify agents requiring coaching.
***
## Key Features
| Capability | Description |
| ----------------------------------- | --------------------------------------------------------------------------------------------------------------------------------------------------------------------------------------------- |
| **Real-time Performance Insights** | Provides near real-time visibility into audit performance, agent quality trends, coaching activity, and fatal interactions across conversations. |
| **Handled By Analysis** | Filter quality metrics by **All**, **AI Agent**, or **Human Agent**. For handoff conversations, evaluations contribute to the respective evaluator metrics (**AI Agent** or **Human Agent**). |
| **Cross-queue Analytics** | Analyzes agent performance across all accessible queues without assignment restrictions. |
| **Direction-aware Analysis** | Compares inbound, outbound, or combined interaction performance using contact direction filters. |
| **Adherence Heatmap** | Visualizes adherence trends, fatal interactions, and evaluation performance based on selected filters. |
| **Agent Leaderboard** | Identifies top and bottom performers using audits completed, audit scores, evaluation scores, and failure rates to support targeted coaching. |
| **Evaluation Score Trends** | Tracks AutoQA and manual audit score trends across daily, weekly, and monthly time views. |
| **Performance Monitoring** | Analyzes score distributions and evaluation performance using selected evaluation forms. Widgets automatically update based on active filters. |
| **Flagged Interactions Visibility** | Provides access to flagged interactions across the QA Dashboard, Audit Screen, and Conversation Mining for quality monitoring and coaching. |
| **Pending Review Tracking** | Monitors evaluations awaiting QA review, agent acknowledgment, or dispute resolution. |
| **Filter-based Analysis** | Applies dashboard-wide filters such as Handled By, language, date range, channel, and contact direction, with synchronized widget updates. |
| **Role-based Access** | Allows App Owners, App Developers, App Testers, and Supervisors with Cross Queue Data Access to view data across all queues. Other users can access only their assigned queues. |
***
## Access Supervisor Dashboard
Navigate to **Quality AI** > **AutoQA** > **Dashboard**.
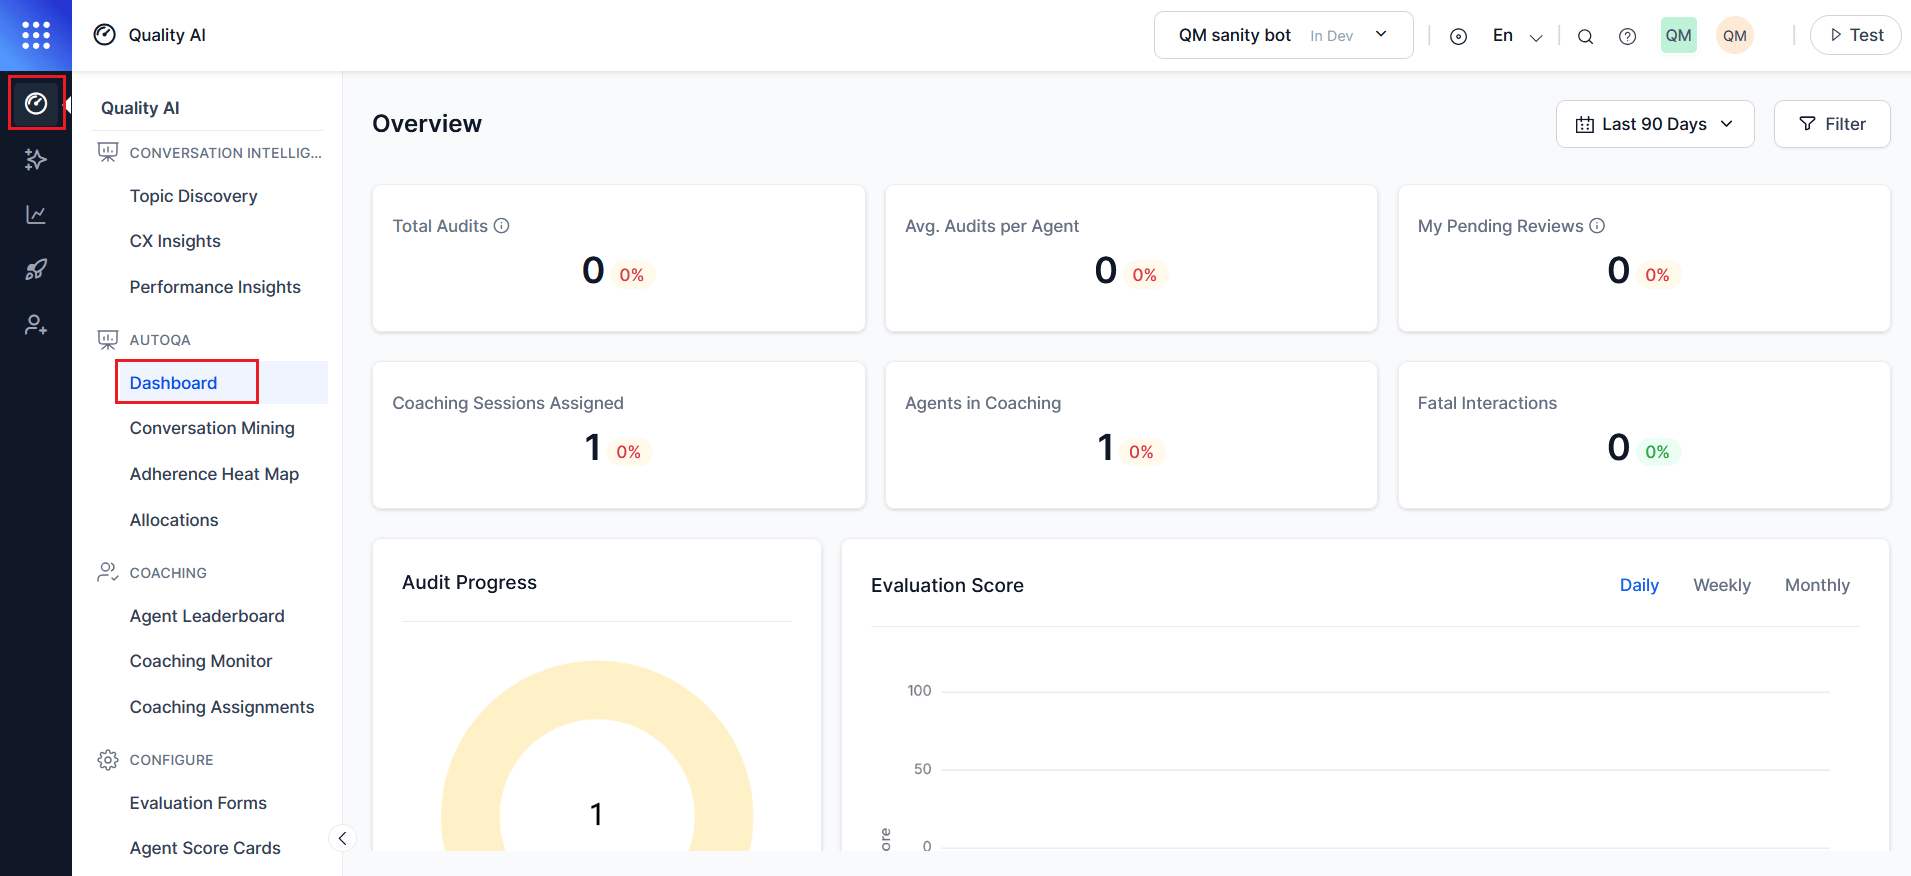 Enable the required settings in [Quality AI General Settings](/ai-for-service/quality-ai/configure/quality-ai-general-settings) and assign the appropriate permissions to access features such as **Agent Scorecard**, **AutoQA**, **Evaluation Forms**, **Adherence Heatmap**, **Performance Monitor**, and **Agent Leaderboard**.
***
### Configuration Requirements
* Enable the required settings in **Quality AI** > **Settings** > **Quality AI General Settings** to access dashboard features and activate the **Agent Accept & Dispute** workflow.
* Assign the required Quality AI permissions to access features such as **Agent Scorecard**, **AutoQA**, **Evaluation Forms**, **Adherence Heatmap**, **Performance Monitor**, and **Agent Leaderboard**.
* Enable **Cross Queue Data Access** for users to view data across all queues.
* Configure and publish evaluation forms and scorecards, and enable **AutoQA** (for automated evaluation scoring) in **Quality AI General Settings**.
***
## Dashboard Filters
The QA Dashboard provides shared global filters across all widgets, consistent with the Agent Dashboard and Audit views.
Use the **Filter** panel from the dashboard header to refine quality and performance analysis by **Date Range**, **Evaluation Forms**, **Conversations Handled By**, **AI Agent Experience Flows**, **Human Agent Queues**, **Human Agents**, **Channels**, **Languages**, and **Contact Direction**.
All selected filters are applied together when **Apply** is selected, and dashboard widgets update dynamically based on the applied criteria.
By default, the dashboard displays data for **All Evaluation Forms**, **All Queues**, **All Languages**, **Last 7 Days**, **All Channels**, and **Both Directions**. Queue options update dynamically based on the selected evaluation forms.
All widgets update dynamically when filters change.
### Date Range
Select a date range using the calendar and apply to refresh the dashboard data.
To filter by calendar,
1. Select the **Calendar** dropdown.
2. Choose a required date range.
3. Select **Apply**.
### Filter Panel
The **Filter** panel provides centralized filtering across all dashboard widgets. Supervisors can filter data by evaluation forms, channels, languages, conversation handler, experience flows, queues, and agents. Filter selections remain pending until you select **Apply**.
| **Filter** | **Description** | **Supported Features** | **Affected Widgets** |
| ------------------------------ | ------------------------------------------------------------------------------------------------------------------------------------------------------------------------------------------------------------------------------------------- | ------------------------------------- | ------------------------------------------------------------------------------------------------------------- |
| **Evaluation Forms** | Filters dashboard data using one or more evaluation forms. The available Experience Flows and Queues update based on the selected forms. | Search, Multi-select, Show all, Clear | Evaluation Score, Adherence Heatmap, Fail Statistics, Performance Monitor |
| **Channels** | Filters interactions by communication channels such as Voice and Chat. | Multi-select | All widgets |
| **Languages** | Filters interactions by one or more configured languages. | Multi-select, Show all, Clear | All widgets |
| **Conversations Handled By** | Select AI Agent, Human Agent, or both to analyze conversations by handler. Selecting AI Agent displays the Experience Flow filter, while selecting Human Agent displays the Queues and Agents filters. | Checkbox selection | All widgets |
| **AI Agent → Experience Flow** | Filters AI Agent conversations using selected Experience Flows. This filter appears when AI Agent is selected under Conversations Handled By. AI Agent conversations are filtered using Experience Flow instead of Queue and Agent filters. | Search, Multi-select, Show all, Clear | Evaluation Score, Adherence Heatmap, Fail Statistics (Evaluation Form), Performance Monitor (Evaluation Form) |
| **Human Agent → Queues** | Filters Human Agent conversations using selected queues. The available Agents update based on the selected queues. | Search, Multi-select, Show all, Clear | Evaluation Score, Adherence Heatmap, Fail Statistics, Performance Monitor, Agent Leaderboard |
| **Human Agent → Agents** | Filters Human Agent conversations using selected agents within the selected queues. This filter appears when Human Agent is selected under Conversations Handled By. | Search, Multi-select, Show all, Clear | Agent Leaderboard, Coaching-related widgets |
Enable the required settings in [Quality AI General Settings](/ai-for-service/quality-ai/configure/quality-ai-general-settings) and assign the appropriate permissions to access features such as **Agent Scorecard**, **AutoQA**, **Evaluation Forms**, **Adherence Heatmap**, **Performance Monitor**, and **Agent Leaderboard**.
***
### Configuration Requirements
* Enable the required settings in **Quality AI** > **Settings** > **Quality AI General Settings** to access dashboard features and activate the **Agent Accept & Dispute** workflow.
* Assign the required Quality AI permissions to access features such as **Agent Scorecard**, **AutoQA**, **Evaluation Forms**, **Adherence Heatmap**, **Performance Monitor**, and **Agent Leaderboard**.
* Enable **Cross Queue Data Access** for users to view data across all queues.
* Configure and publish evaluation forms and scorecards, and enable **AutoQA** (for automated evaluation scoring) in **Quality AI General Settings**.
***
## Dashboard Filters
The QA Dashboard provides shared global filters across all widgets, consistent with the Agent Dashboard and Audit views.
Use the **Filter** panel from the dashboard header to refine quality and performance analysis by **Date Range**, **Evaluation Forms**, **Conversations Handled By**, **AI Agent Experience Flows**, **Human Agent Queues**, **Human Agents**, **Channels**, **Languages**, and **Contact Direction**.
All selected filters are applied together when **Apply** is selected, and dashboard widgets update dynamically based on the applied criteria.
By default, the dashboard displays data for **All Evaluation Forms**, **All Queues**, **All Languages**, **Last 7 Days**, **All Channels**, and **Both Directions**. Queue options update dynamically based on the selected evaluation forms.
All widgets update dynamically when filters change.
### Date Range
Select a date range using the calendar and apply to refresh the dashboard data.
To filter by calendar,
1. Select the **Calendar** dropdown.
2. Choose a required date range.
3. Select **Apply**.
### Filter Panel
The **Filter** panel provides centralized filtering across all dashboard widgets. Supervisors can filter data by evaluation forms, channels, languages, conversation handler, experience flows, queues, and agents. Filter selections remain pending until you select **Apply**.
| **Filter** | **Description** | **Supported Features** | **Affected Widgets** |
| ------------------------------ | ------------------------------------------------------------------------------------------------------------------------------------------------------------------------------------------------------------------------------------------- | ------------------------------------- | ------------------------------------------------------------------------------------------------------------- |
| **Evaluation Forms** | Filters dashboard data using one or more evaluation forms. The available Experience Flows and Queues update based on the selected forms. | Search, Multi-select, Show all, Clear | Evaluation Score, Adherence Heatmap, Fail Statistics, Performance Monitor |
| **Channels** | Filters interactions by communication channels such as Voice and Chat. | Multi-select | All widgets |
| **Languages** | Filters interactions by one or more configured languages. | Multi-select, Show all, Clear | All widgets |
| **Conversations Handled By** | Select AI Agent, Human Agent, or both to analyze conversations by handler. Selecting AI Agent displays the Experience Flow filter, while selecting Human Agent displays the Queues and Agents filters. | Checkbox selection | All widgets |
| **AI Agent → Experience Flow** | Filters AI Agent conversations using selected Experience Flows. This filter appears when AI Agent is selected under Conversations Handled By. AI Agent conversations are filtered using Experience Flow instead of Queue and Agent filters. | Search, Multi-select, Show all, Clear | Evaluation Score, Adherence Heatmap, Fail Statistics (Evaluation Form), Performance Monitor (Evaluation Form) |
| **Human Agent → Queues** | Filters Human Agent conversations using selected queues. The available Agents update based on the selected queues. | Search, Multi-select, Show all, Clear | Evaluation Score, Adherence Heatmap, Fail Statistics, Performance Monitor, Agent Leaderboard |
| **Human Agent → Agents** | Filters Human Agent conversations using selected agents within the selected queues. This filter appears when Human Agent is selected under Conversations Handled By. | Search, Multi-select, Show all, Clear | Agent Leaderboard, Coaching-related widgets |
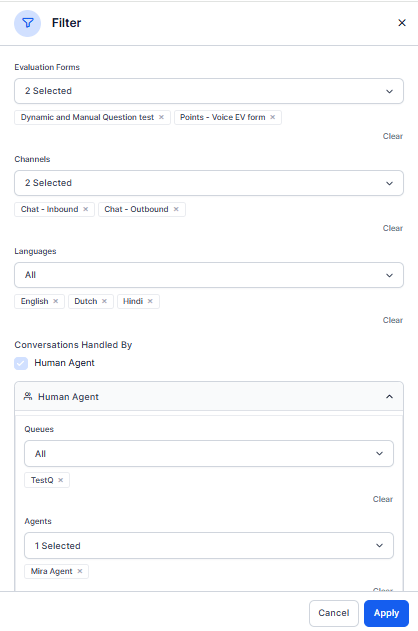 Available filter options update dynamically based on selected values. Evaluation Forms update available Experience Flows and Queues. The Conversations Handled By selection determines whether AI Agent (Experience Flow) or Human Agent (Queues and Agents) filters are displayed.
### Filter Behavior
The dashboard applies all selected filters together when **Apply** is selected.
* Select **AI Agent**, **Human Agent**, or both under **Conversations Handled By**.
* Select **AI Agent** to display the **Experience Flow** filter section.
* Select **Human Agent** to display the **Queues** and **Agents** filter sections.
* Select both **AI Agent** and **Human Agent** to display all applicable filter sections.
* Select **Apply** to apply all selected filters and refresh the dashboard widgets.
When both AI Agent and Human Agent are selected, widgets display combined results while maintaining separate evaluation attribution based on the conversation handler.
For handoff conversations, the dashboard attributes evaluations based on the evaluator type. AI Agent evaluations contribute to AI Agent quality metrics, while Human Agent evaluations contribute to Human Agent quality metrics.
***
## Dashboard Widgets
Provides a high-level summary of audit activity, coaching workload, quality performance, and evaluation review status.
| Metric | Description |
| ------------------------------ | ---------------------------------------------------------------------------------------------------------------------------------------------------------------------------------------------------- |
| **Total Audits** | Displays the total number of completed manual audits. |
| **Avg. Audits per Agent** | Displays the average number of audits completed by each agent in assigned queues. |
| **My Pending Reviews** | Displays the number of disputed evaluations assigned to the signed-in QA that are awaiting re-evaluation response. The count updates automatically when agents submit disputes and QAs resolve them. |
| **Supervisor Pending Reviews** | Displays the number of evaluations awaiting supervisor review or dispute resolution. |
| **Agent Pending Reviews** | Displays the number of evaluations awaiting agent acknowledgement or dispute response. |
| **Coaching Sessions Assigned** | Displays the total number of coaching sessions assigned to agents. |
| **Agents in Coaching** | Displays the number of agents with active coaching assignments in queues the supervisor can access. |
| **Fatal Interactions** | Displays the number of interactions that failed due to fatal evaluation rules. If an interaction meets any fatal criterion, the system assigns a score of zero to the entire scorecard. |
Agent Performance Metrics display combined metrics when both AI Agent and Human Agent conversations are selected. Metrics related to agents, coaching, and scorecards apply only to Human Agent evaluations.
### Audit Progress
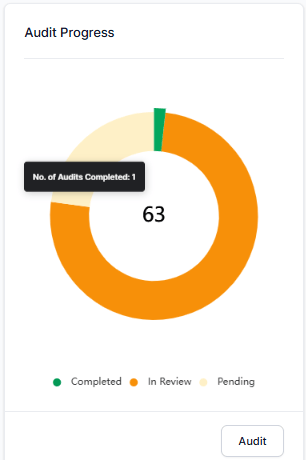
Displays the overall audit status of assigned interactions in a donut chart, showing distribution across audit stages. The total in the center represents all assigned interactions, while each segment indicates its current status.
| Status | Description |
| ------------- | --------------------------------------------- |
| **Completed** | Number of assigned interactions audited. |
| **Pending** | Number of assigned interactions not audited. |
| **In Review** | Number of assigned interactions under review. |
This metric is visible only when these settings are enabled in **Quality AI** > **Settings** > **Quality AI General Settings** and **Agent Accept & Dispute** are configured for one or more evaluation forms.
#### Audit Action
Select **Audit** to navigate to **Conversation Mining** > **Audit Allocations**, where you can start or continue evaluating assigned interactions. For more information exploring and filtering interaction-level data, see [Audit Allocations](/ai-for-service/quality-ai/analyze/conversation-mining-audit-allocations).
Available filter options update dynamically based on selected values. Evaluation Forms update available Experience Flows and Queues. The Conversations Handled By selection determines whether AI Agent (Experience Flow) or Human Agent (Queues and Agents) filters are displayed.
### Filter Behavior
The dashboard applies all selected filters together when **Apply** is selected.
* Select **AI Agent**, **Human Agent**, or both under **Conversations Handled By**.
* Select **AI Agent** to display the **Experience Flow** filter section.
* Select **Human Agent** to display the **Queues** and **Agents** filter sections.
* Select both **AI Agent** and **Human Agent** to display all applicable filter sections.
* Select **Apply** to apply all selected filters and refresh the dashboard widgets.
When both AI Agent and Human Agent are selected, widgets display combined results while maintaining separate evaluation attribution based on the conversation handler.
For handoff conversations, the dashboard attributes evaluations based on the evaluator type. AI Agent evaluations contribute to AI Agent quality metrics, while Human Agent evaluations contribute to Human Agent quality metrics.
***
## Dashboard Widgets
Provides a high-level summary of audit activity, coaching workload, quality performance, and evaluation review status.
| Metric | Description |
| ------------------------------ | ---------------------------------------------------------------------------------------------------------------------------------------------------------------------------------------------------- |
| **Total Audits** | Displays the total number of completed manual audits. |
| **Avg. Audits per Agent** | Displays the average number of audits completed by each agent in assigned queues. |
| **My Pending Reviews** | Displays the number of disputed evaluations assigned to the signed-in QA that are awaiting re-evaluation response. The count updates automatically when agents submit disputes and QAs resolve them. |
| **Supervisor Pending Reviews** | Displays the number of evaluations awaiting supervisor review or dispute resolution. |
| **Agent Pending Reviews** | Displays the number of evaluations awaiting agent acknowledgement or dispute response. |
| **Coaching Sessions Assigned** | Displays the total number of coaching sessions assigned to agents. |
| **Agents in Coaching** | Displays the number of agents with active coaching assignments in queues the supervisor can access. |
| **Fatal Interactions** | Displays the number of interactions that failed due to fatal evaluation rules. If an interaction meets any fatal criterion, the system assigns a score of zero to the entire scorecard. |
Agent Performance Metrics display combined metrics when both AI Agent and Human Agent conversations are selected. Metrics related to agents, coaching, and scorecards apply only to Human Agent evaluations.
### Audit Progress
Displays the overall audit status of assigned interactions in a donut chart, showing distribution across audit stages. The total in the center represents all assigned interactions, while each segment indicates its current status.
| Status | Description |
| ------------- | --------------------------------------------- |
| **Completed** | Number of assigned interactions audited. |
| **Pending** | Number of assigned interactions not audited. |
| **In Review** | Number of assigned interactions under review. |
This metric is visible only when these settings are enabled in **Quality AI** > **Settings** > **Quality AI General Settings** and **Agent Accept & Dispute** are configured for one or more evaluation forms.
#### Audit Action
Select **Audit** to navigate to **Conversation Mining** > **Audit Allocations**, where you can start or continue evaluating assigned interactions. For more information exploring and filtering interaction-level data, see [Audit Allocations](/ai-for-service/quality-ai/analyze/conversation-mining-audit-allocations).
 ### Evaluation Score
Displays the trend of the average Kore Evaluation Score (AutoQA) and average Audit Score (manual) over daily, weekly, or monthly interval views based on selected filter options such as Forms, Channels, Languages, Queues, and Agents.
### Evaluation Score
Displays the trend of the average Kore Evaluation Score (AutoQA) and average Audit Score (manual) over daily, weekly, or monthly interval views based on selected filter options such as Forms, Channels, Languages, Queues, and Agents.
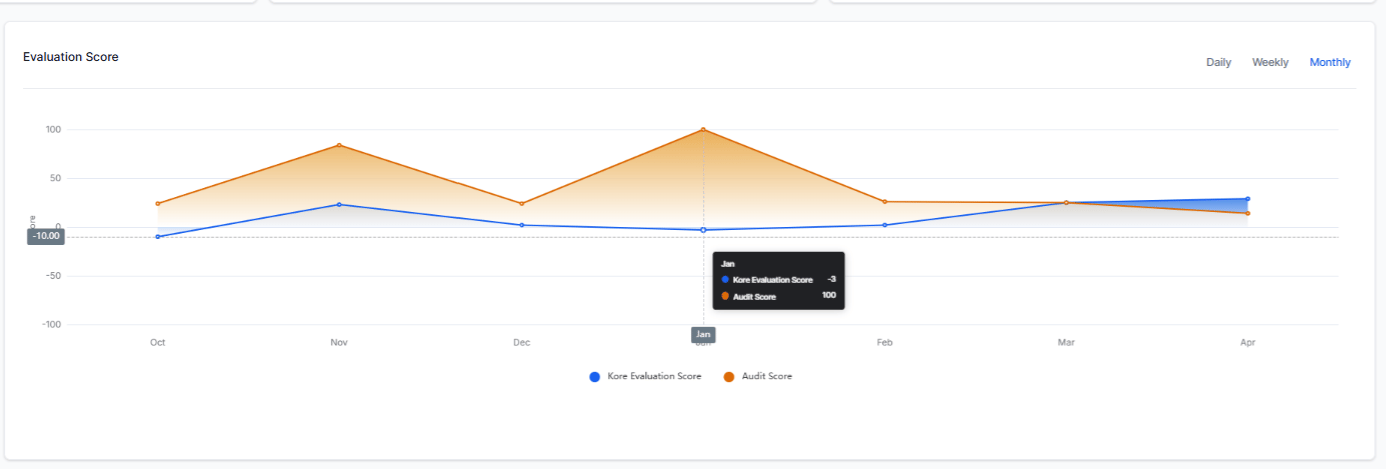 When **Agent Accept & Dispute** is enabled in Quality AI > Settings, Audit Score reflects the latest revised score after re-evaluation.
***
### Adherence Heatmap
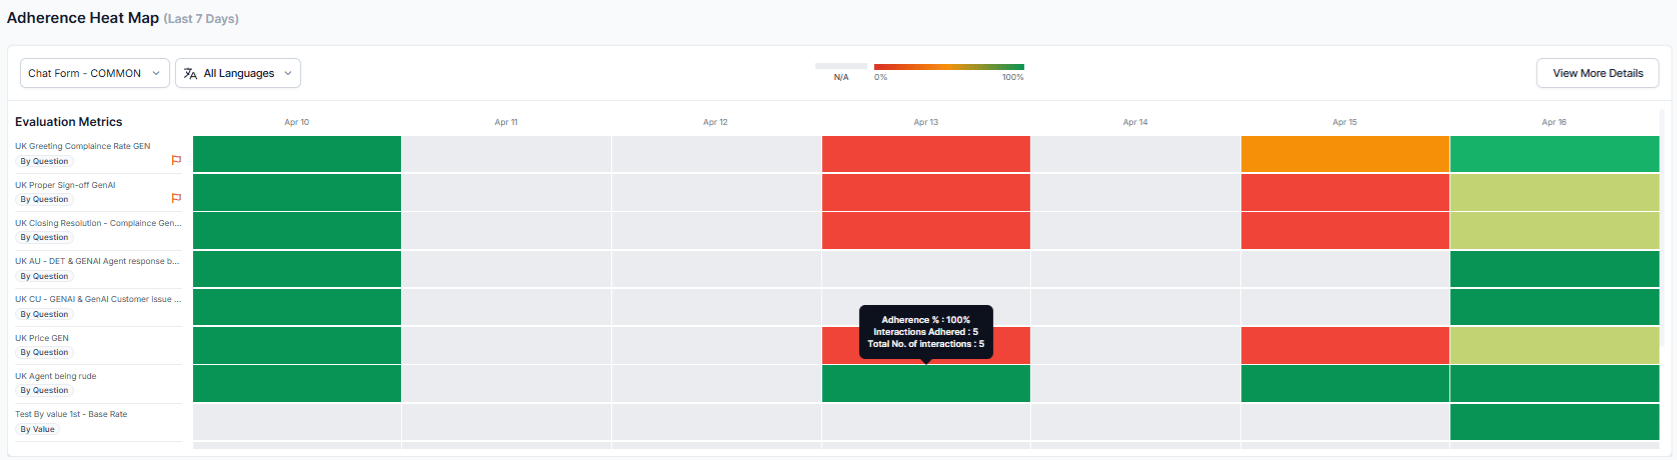
Displays a 7-day adherence snapshot for the selected evaluation form and conversation handler. For AI Agent analysis, adherence data is based on Experience Flow evaluations. For Human Agent analysis, adherence data is based on queue and agent evaluations.
Hover over a tile to view adherence percentage, interaction count, and total evaluated interactions for a selected date and agents. Use **Mark as Default** to set a default evaluation form and maintain consistent data across the Adherence Heatmap and QA Dashboard.
When **Agent Accept & Dispute** is enabled in Quality AI > Settings, Audit Score reflects the latest revised score after re-evaluation.
***
### Adherence Heatmap
Displays a 7-day adherence snapshot for the selected evaluation form and conversation handler. For AI Agent analysis, adherence data is based on Experience Flow evaluations. For Human Agent analysis, adherence data is based on queue and agent evaluations.
Hover over a tile to view adherence percentage, interaction count, and total evaluated interactions for a selected date and agents. Use **Mark as Default** to set a default evaluation form and maintain consistent data across the Adherence Heatmap and QA Dashboard.
 | Option | Description |
| -------------------------------- | -------------------------------------------------------------------------------------------------------------- |
| **Evaluation Form** | Select evaluation form for adherence metrics and fatal interactions. |
| **Language** | Filters adherence metrics by selected language. |
| \*\*Experience Flow / Queue \*\* | Displays Experience Flows for AI Agent analysis and Queues for Human Agent analysis based on selected handler. |
| **Tooltip Insights** | Displays adherence percentage, interaction count, and total evaluated interactions. |
Enable AutoQA in **Quality AI** > **Settings** > **Quality AI General Settings** to configure evaluation forms and generate automated scores.
#### View More Details
Select **View More Details** to open the detailed [Adherence Heatmap](/ai-for-service/quality-ai/analyze/adherence-heatmap) and view evaluation form-based trends.
***
### Fail Statistics
The **Fail Statistics** widget helps supervisors identify quality issues by tracking failed and fatal interactions over time. It provides trend analysis across **Evaluation Forms** and **Agent Scorecards**, enabling supervisors to monitor failure rates and analyze performance based on the selected conversation handler.
The widget updates dynamically based on dashboard filters, including **Conversations Handled By**, **Evaluation Form**, **Queues**, **Experience Flows**, **Language**, **Channel**, **Contact Direction**, and **Date Range**.
Use Fail Statistics to:
* Monitor the total number of failed interactions.
* Compare failed and fatal interaction trends.
* Analyze failures by **Evaluation Form** or **Agent Scorecard**.
* Filter results by **Human Agent Queues** or **AI Agent Experience Flows**.
* View failure trends across **Daily**, **Weekly**, or **Monthly** intervals.
Fail Statistics displays evaluation data based on the selected **Conversations Handled By** option. When **AI Agent** is selected, it shows **AI Agent** evaluation data based on selected **Experience Flows**. When a **Human Agent** is selected, it shows **Human Agent** evaluation data based on selected **Queues** and supports **Agent Scorecard** analysis, which is available only for **Human Agent** evaluations.
#### Evaluation Form
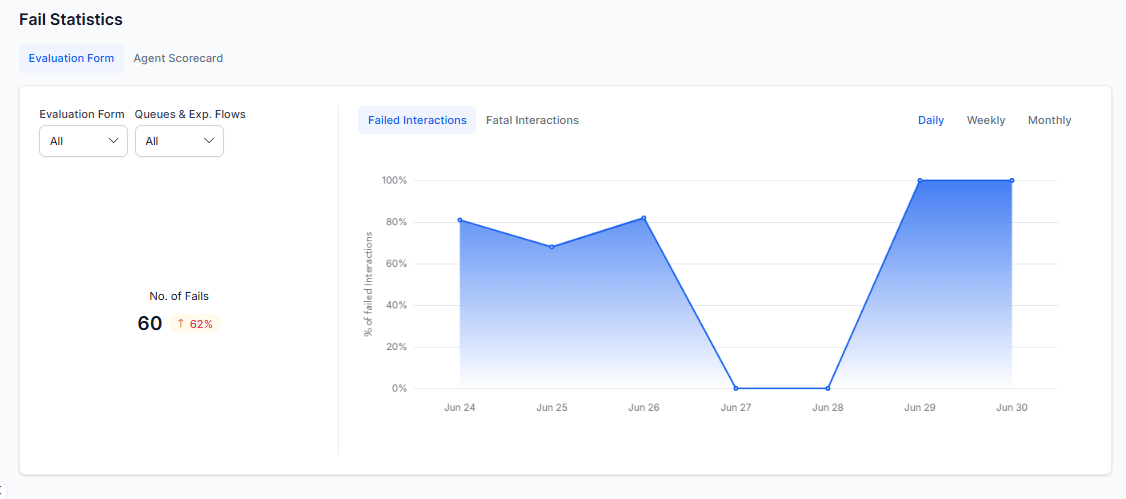
Displays failed and fatal interaction trends across selected evaluation forms and queues. Hover over the chart to view detailed failure percentages and metric-level scores.
| Option | Description |
| -------------------------------- | -------------------------------------------------------------------------------------------------------------- |
| **Evaluation Form** | Select evaluation form for adherence metrics and fatal interactions. |
| **Language** | Filters adherence metrics by selected language. |
| \*\*Experience Flow / Queue \*\* | Displays Experience Flows for AI Agent analysis and Queues for Human Agent analysis based on selected handler. |
| **Tooltip Insights** | Displays adherence percentage, interaction count, and total evaluated interactions. |
Enable AutoQA in **Quality AI** > **Settings** > **Quality AI General Settings** to configure evaluation forms and generate automated scores.
#### View More Details
Select **View More Details** to open the detailed [Adherence Heatmap](/ai-for-service/quality-ai/analyze/adherence-heatmap) and view evaluation form-based trends.
***
### Fail Statistics
The **Fail Statistics** widget helps supervisors identify quality issues by tracking failed and fatal interactions over time. It provides trend analysis across **Evaluation Forms** and **Agent Scorecards**, enabling supervisors to monitor failure rates and analyze performance based on the selected conversation handler.
The widget updates dynamically based on dashboard filters, including **Conversations Handled By**, **Evaluation Form**, **Queues**, **Experience Flows**, **Language**, **Channel**, **Contact Direction**, and **Date Range**.
Use Fail Statistics to:
* Monitor the total number of failed interactions.
* Compare failed and fatal interaction trends.
* Analyze failures by **Evaluation Form** or **Agent Scorecard**.
* Filter results by **Human Agent Queues** or **AI Agent Experience Flows**.
* View failure trends across **Daily**, **Weekly**, or **Monthly** intervals.
Fail Statistics displays evaluation data based on the selected **Conversations Handled By** option. When **AI Agent** is selected, it shows **AI Agent** evaluation data based on selected **Experience Flows**. When a **Human Agent** is selected, it shows **Human Agent** evaluation data based on selected **Queues** and supports **Agent Scorecard** analysis, which is available only for **Human Agent** evaluations.
#### Evaluation Form
Displays failed and fatal interaction trends across selected evaluation forms and queues. Hover over the chart to view detailed failure percentages and metric-level scores.
 #### Agent Scorecard
Displays failed interaction trends based on selected scorecard metrics. If you mark a metric as fatal, assign a zero score to the interaction and flag it across modules. Hover over the chart to view failure percentages and metric-level scores.
#### Agent Scorecard
Displays failed interaction trends based on selected scorecard metrics. If you mark a metric as fatal, assign a zero score to the interaction and flag it across modules. Hover over the chart to view failure percentages and metric-level scores.
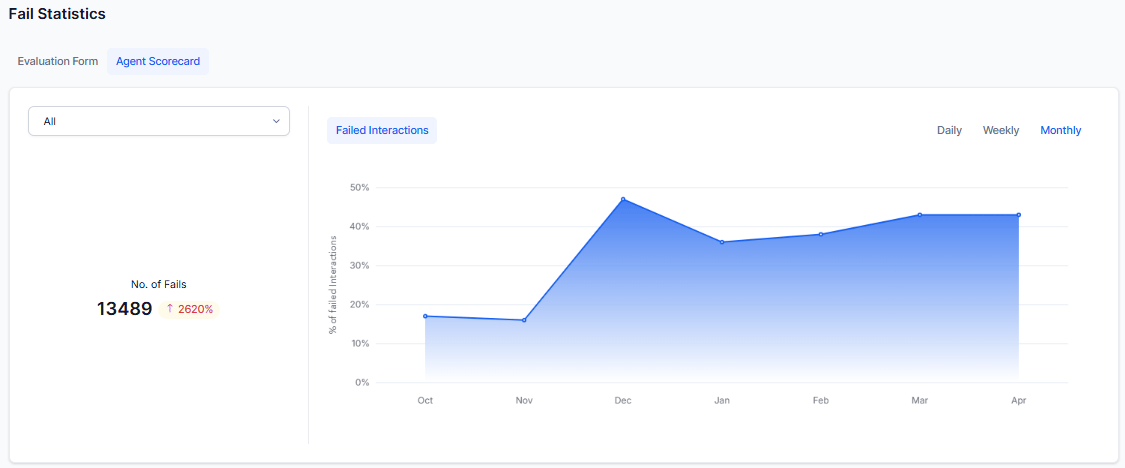 The widget updates automatically based on the applied dashboard filters.
| **Element** | **Description** |
| ----------------------------- | -------------------------------------------------------------------------------------------------------------- |
| **Evaluation Form** | Selects the evaluation form used to calculate failure statistics. |
| **Queues & Experience Flows** | Filters results by Queues or AI Experience Flows. Supports separate tabs with search and multi-select options. |
| **No. of Fails** | Displays the total number of failed interactions and the percentage change compared to the previous period. |
| **Failed Interactions** | Shows trends of failed interactions over time. |
| **Fatal Interactions** | Displays interactions that triggered one or more configured fatal metrics. |
| **Trend Interval** | Allows selection of trend view by **Daily**, **Weekly**, or **Monthly** intervals. |
* The widget updates automatically based on the selected dashboard filters.
* When **Handled By** is set to **AI Agent**, only AI Agent evaluation data is displayed.
* The **Agent Scorecard** view is unavailable for AI Agent analysis because scorecards apply only to **Human Agent** evaluations.
***
### Performance Monitor
Displays performance trends and score distributions using Evaluation Forms for AI Agent and Human Agent conversations. Agent Scorecard analysis is available only for Human Agent evaluations.
#### Evaluation Form
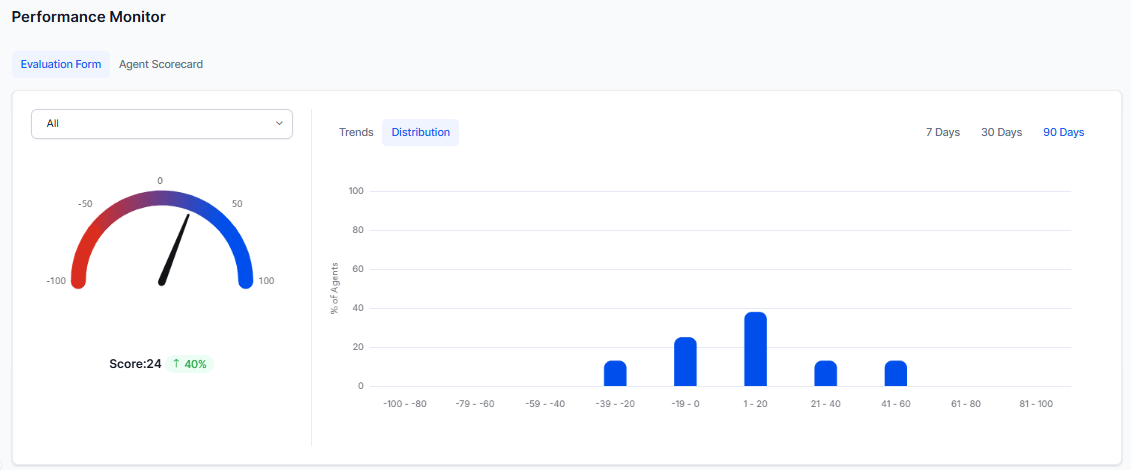
Displays performance trends and evaluation scores for selected evaluation forms and queues. Supervisors can switch between **Trends** and **Distribution** views and analyze data across daily, weekly, and monthly intervals.
The widget updates automatically based on the applied dashboard filters.
| **Element** | **Description** |
| ----------------------------- | -------------------------------------------------------------------------------------------------------------- |
| **Evaluation Form** | Selects the evaluation form used to calculate failure statistics. |
| **Queues & Experience Flows** | Filters results by Queues or AI Experience Flows. Supports separate tabs with search and multi-select options. |
| **No. of Fails** | Displays the total number of failed interactions and the percentage change compared to the previous period. |
| **Failed Interactions** | Shows trends of failed interactions over time. |
| **Fatal Interactions** | Displays interactions that triggered one or more configured fatal metrics. |
| **Trend Interval** | Allows selection of trend view by **Daily**, **Weekly**, or **Monthly** intervals. |
* The widget updates automatically based on the selected dashboard filters.
* When **Handled By** is set to **AI Agent**, only AI Agent evaluation data is displayed.
* The **Agent Scorecard** view is unavailable for AI Agent analysis because scorecards apply only to **Human Agent** evaluations.
***
### Performance Monitor
Displays performance trends and score distributions using Evaluation Forms for AI Agent and Human Agent conversations. Agent Scorecard analysis is available only for Human Agent evaluations.
#### Evaluation Form
Displays performance trends and evaluation scores for selected evaluation forms and queues. Supervisors can switch between **Trends** and **Distribution** views and analyze data across daily, weekly, and monthly intervals.
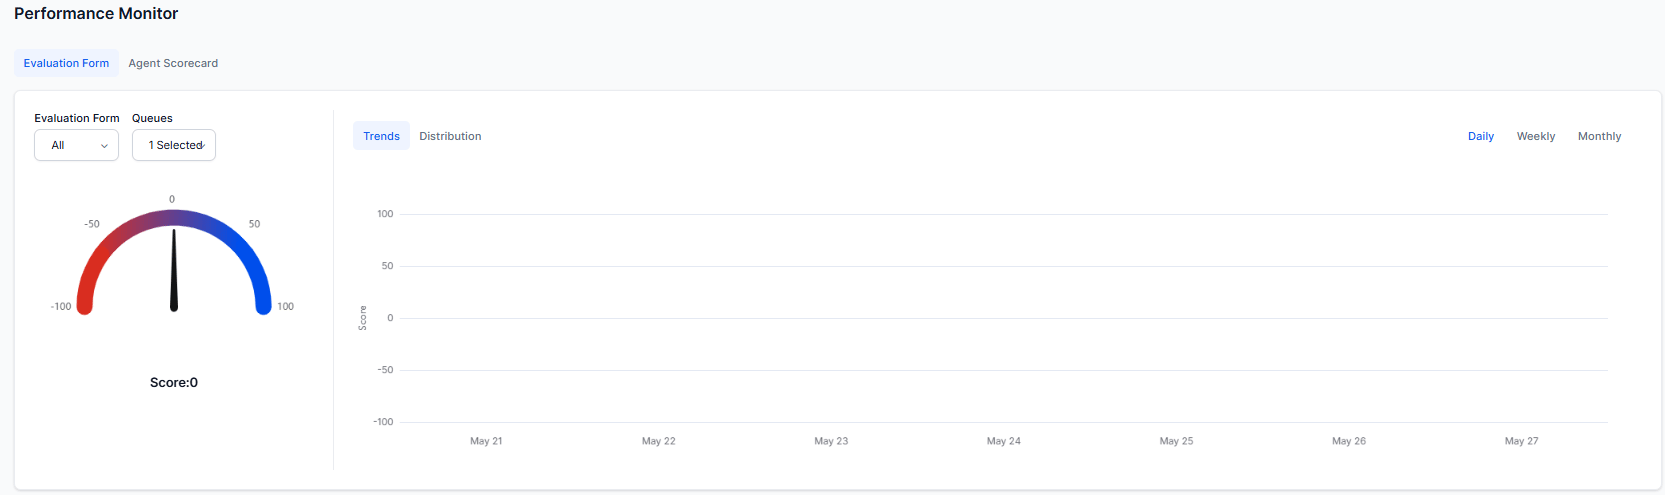 The score gauge shows the average evaluation score for the selected filters and date range.
| View | Description |
| ---------------- | ---------------------------------------------------------------------------------------------------------- |
| **Trends** | Displays evaluation score trends over time using a performance graph. |
| **Distribution** | Displays agent score distribution across defined ranges (for example, 0–10, 11–20) over 7, 30, or 90 days. |
The score gauge shows the average evaluation score for the selected filters and date range.
| View | Description |
| ---------------- | ---------------------------------------------------------------------------------------------------------- |
| **Trends** | Displays evaluation score trends over time using a performance graph. |
| **Distribution** | Displays agent score distribution across defined ranges (for example, 0–10, 11–20) over 7, 30, or 90 days. |
 #### Agent Scorecard
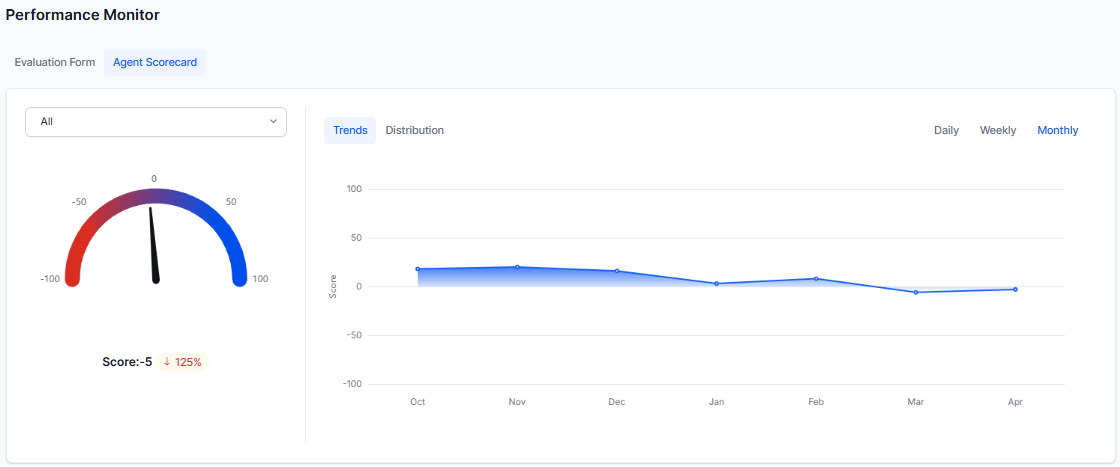
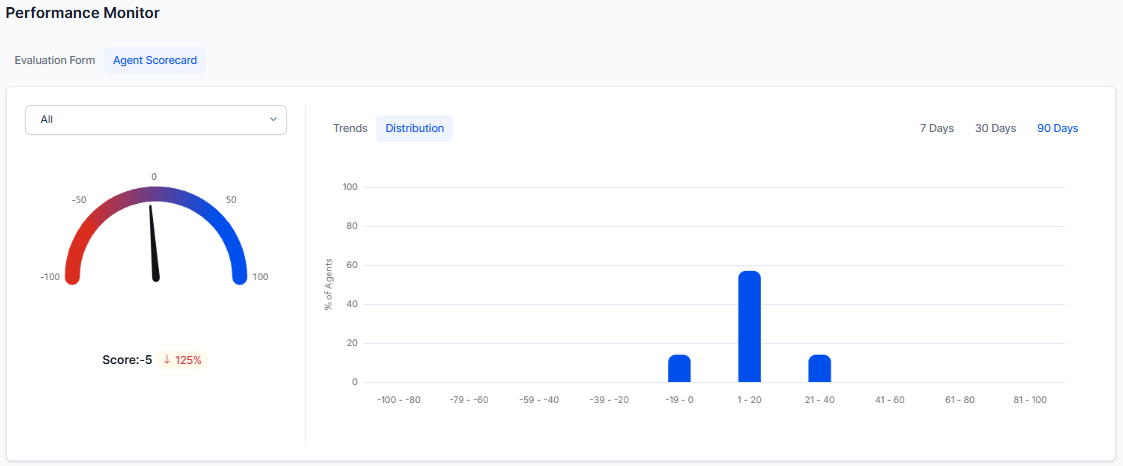
Displays scorecard-based performance trends and score distribution using selected scorecard metrics.
#### Agent Scorecard
Displays scorecard-based performance trends and score distribution using selected scorecard metrics.
 | View | Description |
| ---------------- | ------------------------------------------------------------------------------------- |
| **Trends** | Displays failed interaction percentage trends over time. |
| **Distribution** | Displays agent distribution across configured score bands (for example, 0–10, 11–20). |
| View | Description |
| ---------------- | ------------------------------------------------------------------------------------- |
| **Trends** | Displays failed interaction percentage trends over time. |
| **Distribution** | Displays agent distribution across configured score bands (for example, 0–10, 11–20). |
 The **Agent Scorecard** tab displays only when enabled in **Quality AI** > **Settings** > **Quality AI General Settings**.
***
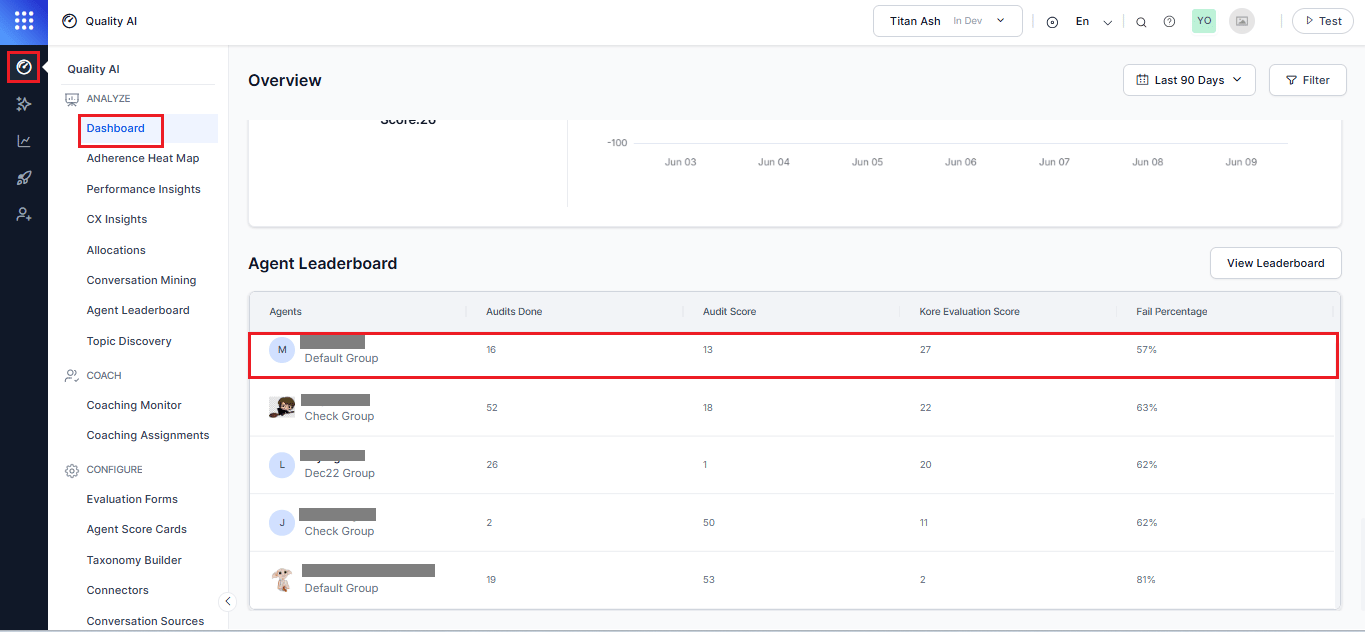
### Agent Leaderboard
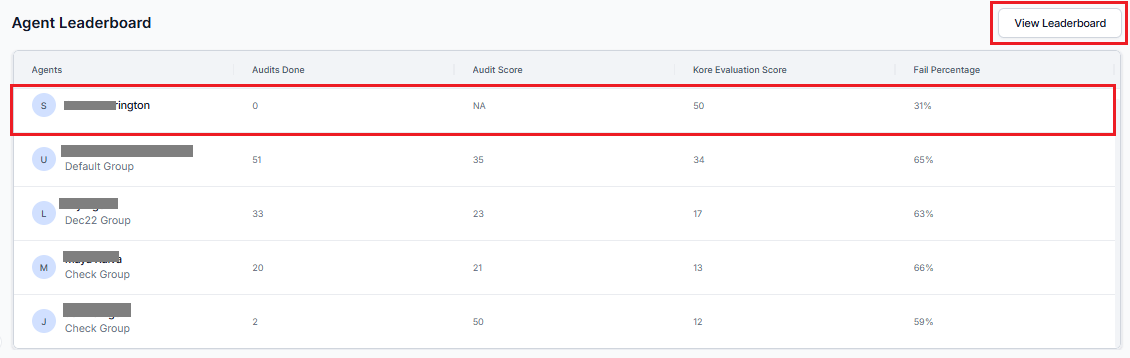
Provides a centralized view of ranked agent performance to help supervisors identify top and bottom performers for recognition and targeted coaching. The leaderboard updates dynamically based on the selected Queue filter and works independently of Language and Channel filters.
The Agent Leaderboard supports Human Agent performance analysis only. AI Agent conversations are analyzed through Evaluation Form-based widgets such as Evaluation Score, Fail Statistics, and Performance Monitor.
Select an agent or **View Leaderboard** to open detailed performance insights.
#### Leaderboard Columns
| Column | Description |
| ------------------------- | -------------------------------------------------------------------------------------------------------------- |
| **Agents** | Displays the agent group name and assigned queue. |
| **Audit Completed** | Displays the total number of audited interactions completed by each agent. |
| **Audit Score** | Displays the average manual audit score, including the latest revised score for any re-evaluated interactions. |
| **Kore Evaluation Score** | Displays the average AutoQA score for audited interactions. |
| **Fail Percentage** | Displays the percentage of failed interactions across all audits. |
When Agent Accept & Dispute is enabled in Quality AI > Settings > Quality AI General Settings, Audit Score reflects the latest revised score after re-evaluation.
For more information about ranked agent performance and associated conversations, see [Agent Leaderboard](/ai-for-service/quality-ai/analyze/agent-leaderboard).
#### View Leaderboard
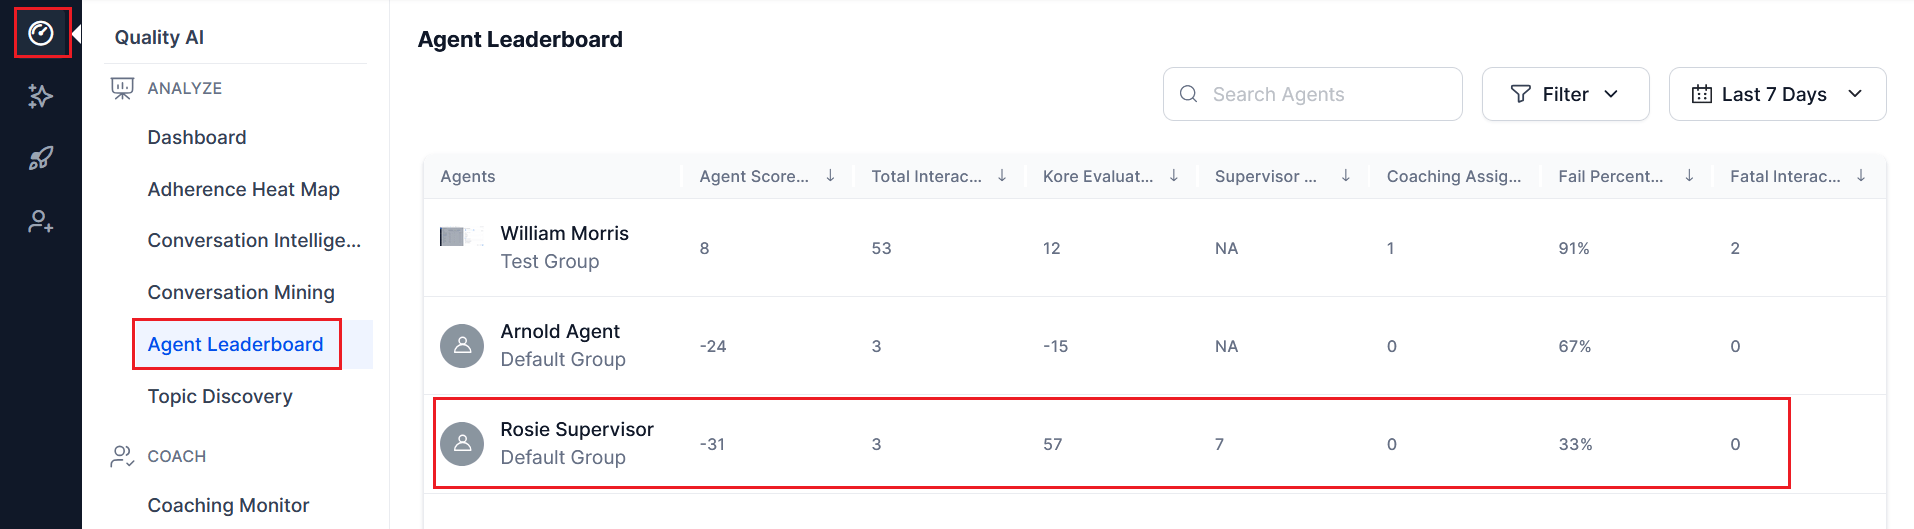
Displays top and bottom performers along with their associated conversations.
The **Agent Scorecard** tab displays only when enabled in **Quality AI** > **Settings** > **Quality AI General Settings**.
***
### Agent Leaderboard
Provides a centralized view of ranked agent performance to help supervisors identify top and bottom performers for recognition and targeted coaching. The leaderboard updates dynamically based on the selected Queue filter and works independently of Language and Channel filters.
The Agent Leaderboard supports Human Agent performance analysis only. AI Agent conversations are analyzed through Evaluation Form-based widgets such as Evaluation Score, Fail Statistics, and Performance Monitor.
Select an agent or **View Leaderboard** to open detailed performance insights.
#### Leaderboard Columns
| Column | Description |
| ------------------------- | -------------------------------------------------------------------------------------------------------------- |
| **Agents** | Displays the agent group name and assigned queue. |
| **Audit Completed** | Displays the total number of audited interactions completed by each agent. |
| **Audit Score** | Displays the average manual audit score, including the latest revised score for any re-evaluated interactions. |
| **Kore Evaluation Score** | Displays the average AutoQA score for audited interactions. |
| **Fail Percentage** | Displays the percentage of failed interactions across all audits. |
When Agent Accept & Dispute is enabled in Quality AI > Settings > Quality AI General Settings, Audit Score reflects the latest revised score after re-evaluation.
For more information about ranked agent performance and associated conversations, see [Agent Leaderboard](/ai-for-service/quality-ai/analyze/agent-leaderboard).
#### View Leaderboard
Displays top and bottom performers along with their associated conversations.
 You can access the full **Agent Leaderboard** by navigating to:
* **Quality AI** > **Dashboard** > **Agent Leaderboard**.
You can access the full **Agent Leaderboard** by navigating to:
* **Quality AI** > **Dashboard** > **Agent Leaderboard**.
 * **Quality AI** > **Agent Leaderboard**.
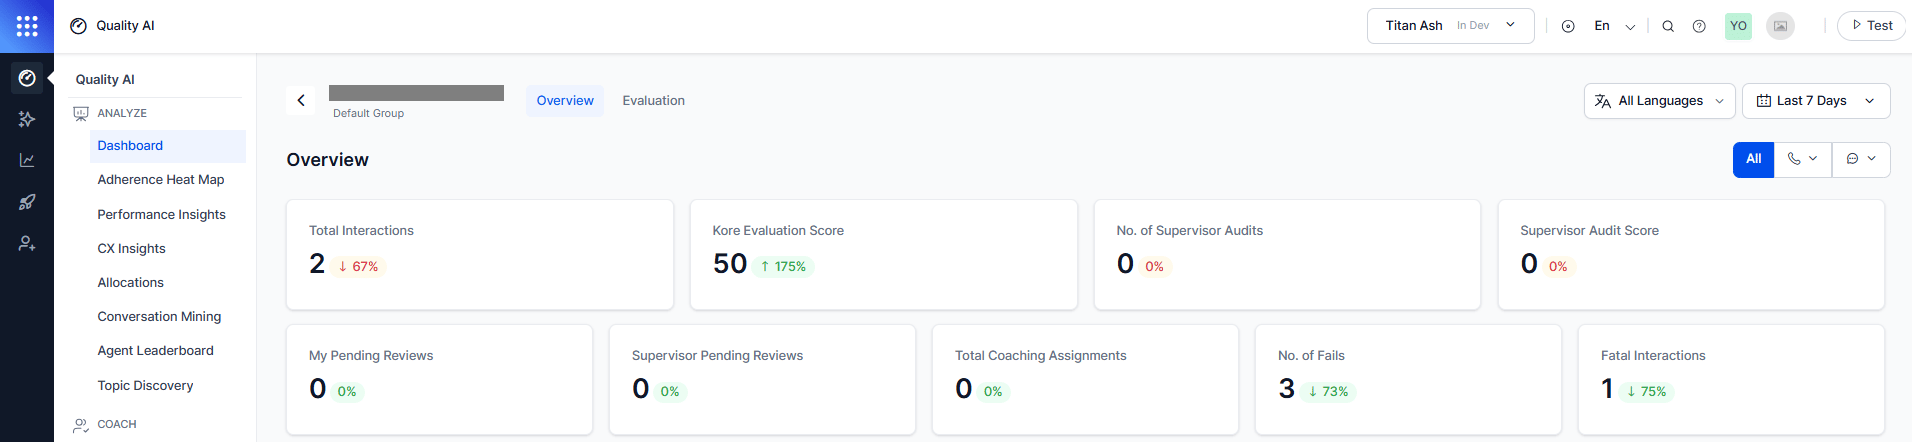
 * Select any agent to view their individual dashboard (Agent Leaderboard or Agent-Specific Dashboard).
 #### Supervisor Insights and Coaching Support
Supervisors can review interactions, evaluation details, bookmarked conversations, and coaching insights to support targeted coaching activities.
Supervisors can use bookmarked interactions to assign coaching tasks. The system displays the most recent interactions first. If an agent doesn’t have an assigned scorecard, supervisors can't view that agent’s scorecard details.
Coaching assignments and coaching-related widgets apply only to Human Agent evaluations.
For more information, see [Supervisor View with Agent-Specific Dashboard](/ai-for-service/quality-ai/analyze/supervisor-view-agent-specific-dashboard) and [Agent Dashboard - Agent View](/ai-for-service/quality-ai/analyze/my-dashboard-agent-view).
#### Supervisor Insights and Coaching Support
Supervisors can review interactions, evaluation details, bookmarked conversations, and coaching insights to support targeted coaching activities.
Supervisors can use bookmarked interactions to assign coaching tasks. The system displays the most recent interactions first. If an agent doesn’t have an assigned scorecard, supervisors can't view that agent’s scorecard details.
Coaching assignments and coaching-related widgets apply only to Human Agent evaluations.
For more information, see [Supervisor View with Agent-Specific Dashboard](/ai-for-service/quality-ai/analyze/supervisor-view-agent-specific-dashboard) and [Agent Dashboard - Agent View](/ai-for-service/quality-ai/analyze/my-dashboard-agent-view).